
Chapter 6.2
The Profit and Loss and the Income Statement
How to read the statement that says whether the business made money: its sections from revenue to net income, the trend and working-paper views, and how to correct the way accounts are presented on it.
When you finish this chapter you will be able to:
- Read the Profit and Loss from top to bottom and say what each subtotal means.
- Work out gross margin and operating margin from it.
- Use the trend and working-paper views.
- Fix an account that is presented in the wrong section.
- Choose between the Profit and Loss and the Income Statement.
Contents
Reading it from the top
| Line | What it means | Summit, Jan–Oct 2026 |
|---|---|---|
| Gross revenue | Everything invoiced or sold | 1,813,529.78 |
| Less returns, allowances, discounts | Money given back | (38,434.70) |
| Net revenue | What the business really earned from sales | 1,775,095.08 |
| Cost of sales | The cost of the goods and contracted services sold | (1,052,216.73) |
| Gross profit | What is left to run the business | 722,878.35 (40.7%) |
| Operating expenses | Wages, rent, utilities, marketing and so on | (615,790.25) |
| Operating income | Profit from the business itself | 107,088.10 (6.0%) |
| Other income (expense) | Interest earned and paid | (1,597.47) |
| Income tax expense | Federal and state income taxes | (30,018.03) |
| Net income | The bottom line | 75,472.60 (4.3%) |
Revenue grows and falls with the season; margins tell you whether the business is healthy. Run the report with Percentages: Of net revenue (Chapter 6.1) and compare gross margin and operating margin quarter to quarter.
Fix how accounts are presented
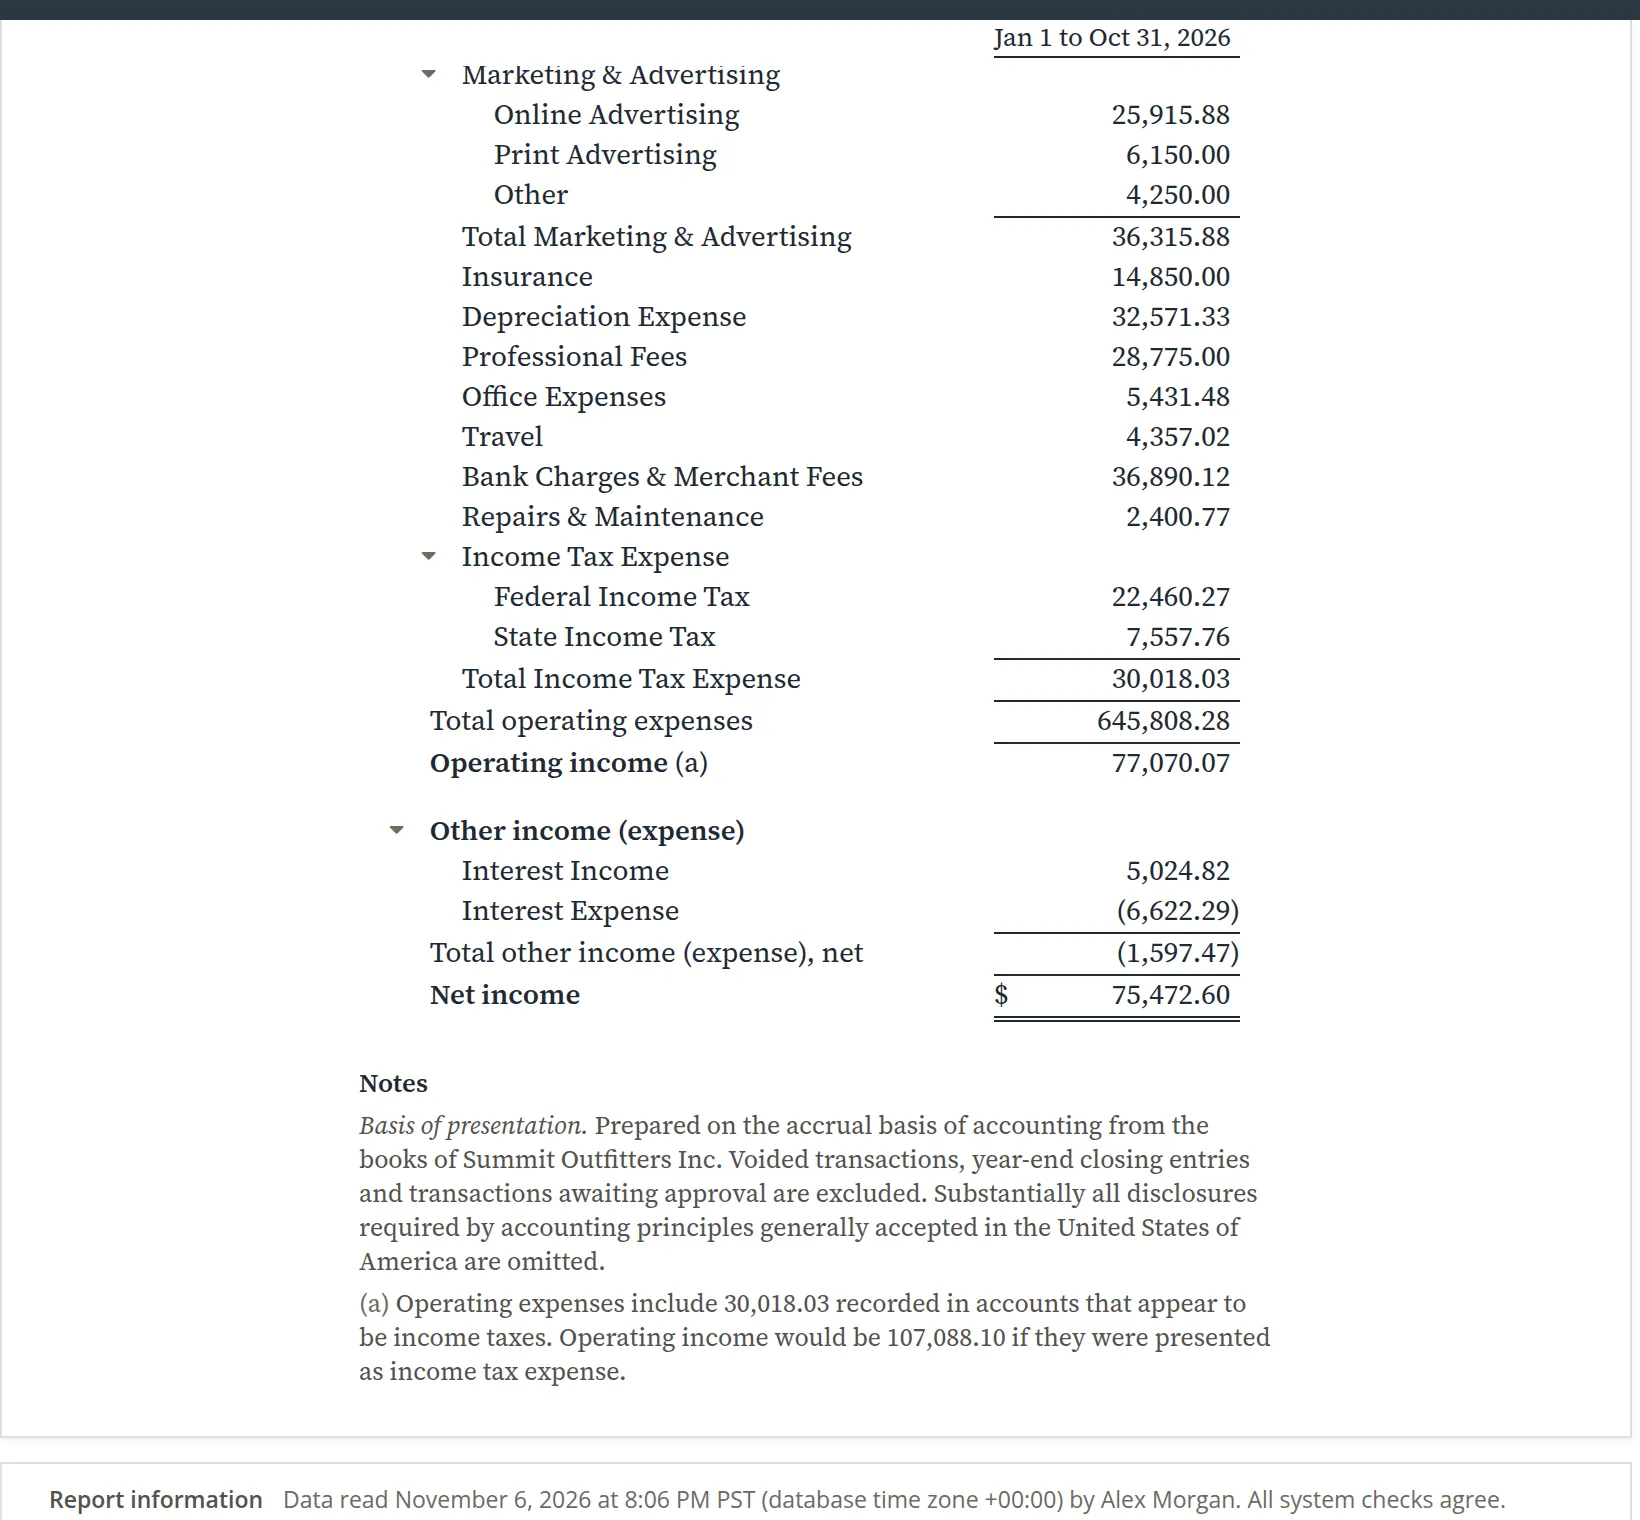
BizBooks360 checks the statement's classification each time it runs. Summit's income tax accounts sat under Operating Expenses, which understated operating income by $30,018.03, so the statement was marked Draft with a note explaining why.
- 1
Read the yellow review notice at the top of the report
- 2
Click the button it offers
Here Present them as income tax expense. For any other change, Change statement lines lets you choose which section each account appears in.
- 3
Check the result
A banner confirms the change and says it is listed in the report information; the Draft mark is gone.

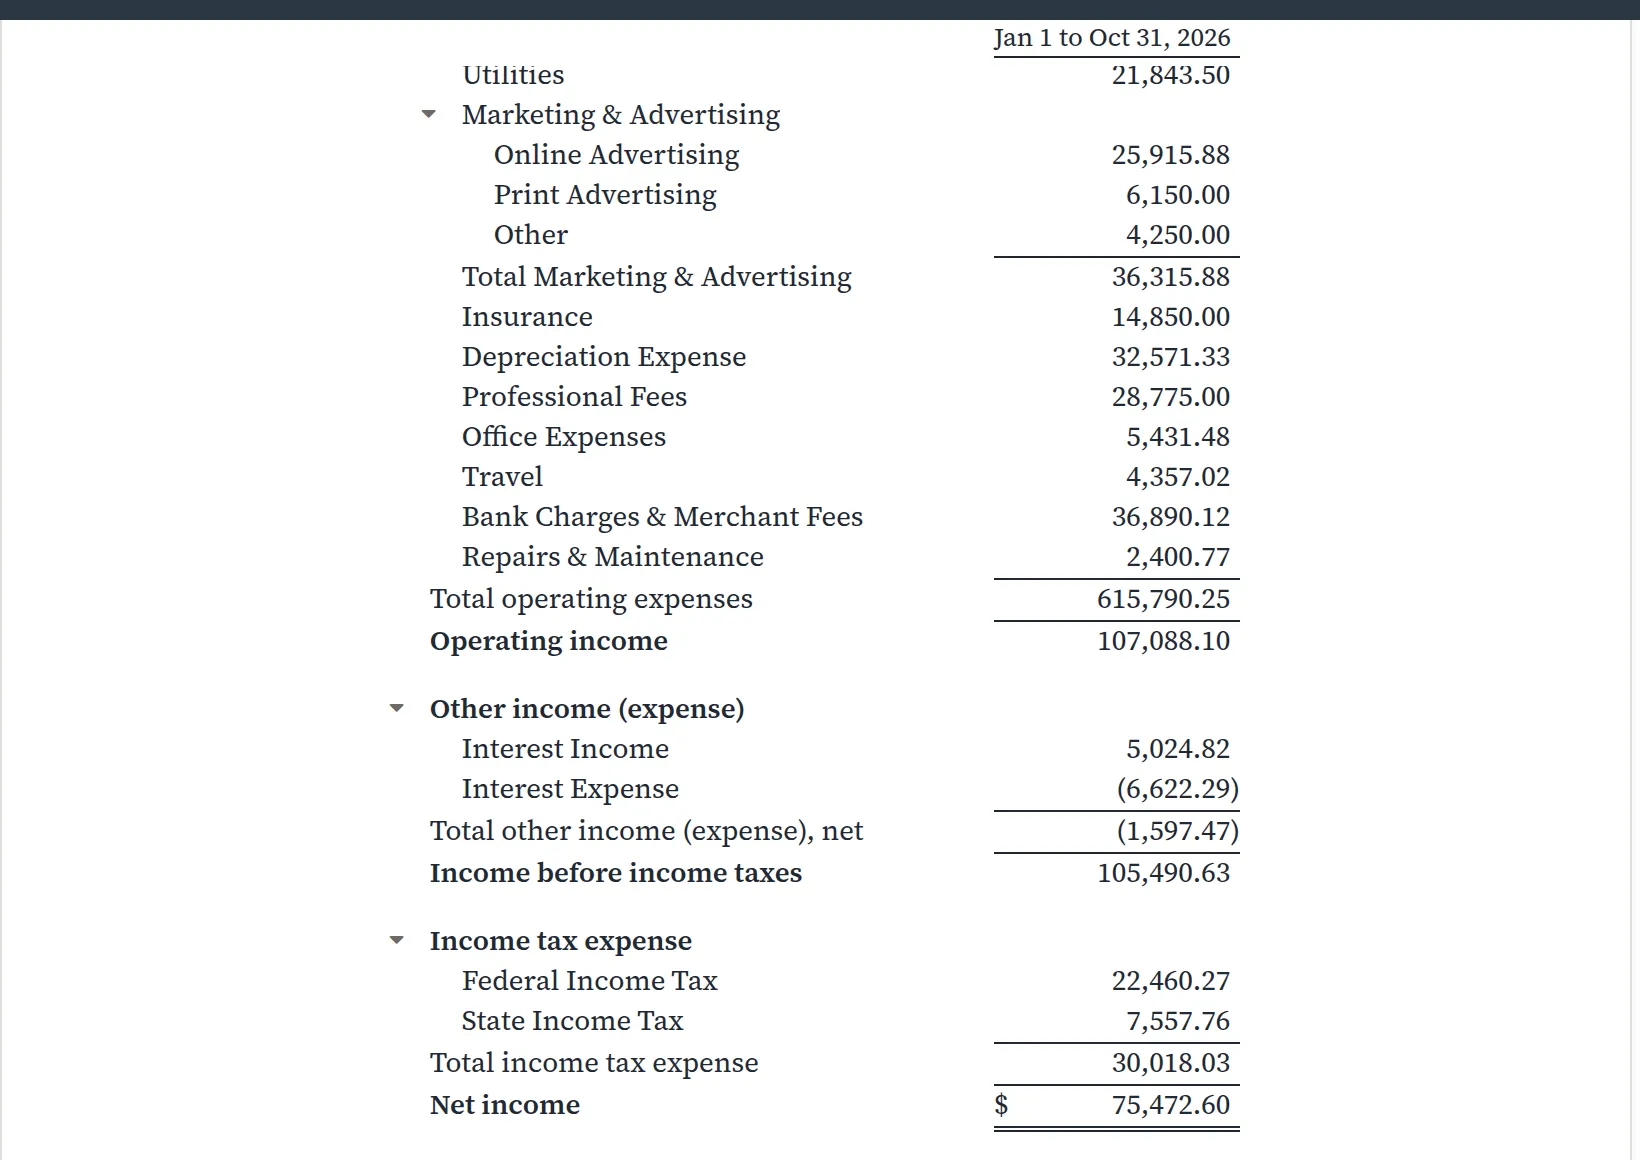
Net income did not change: no entry was touched, only where two accounts appear. That is why such fixes are safe to make at any time, even after a period is closed.
Trend and working paper
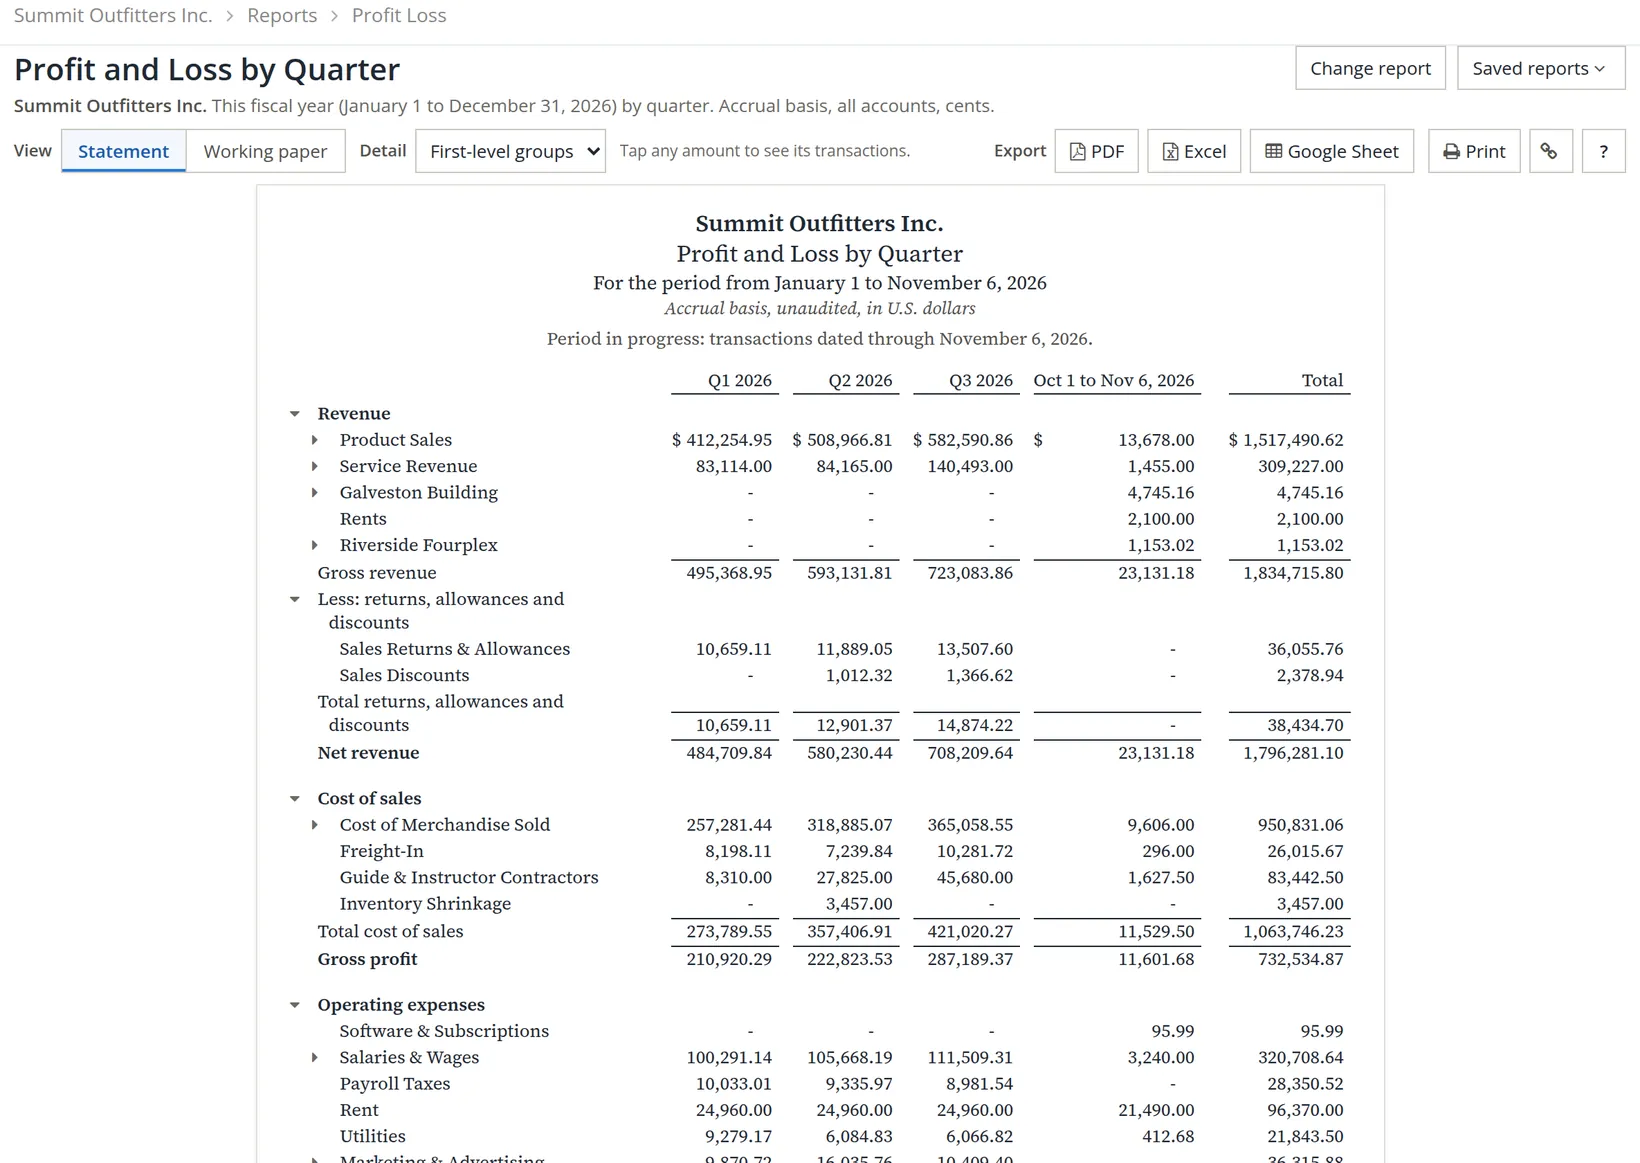
Trend. Change report → Columns: Trend, then by week, month, quarter or year. A quarterly trend shows Summit's busy third quarter: gross profit of $287,189.37 against $210,920.29 in the first.
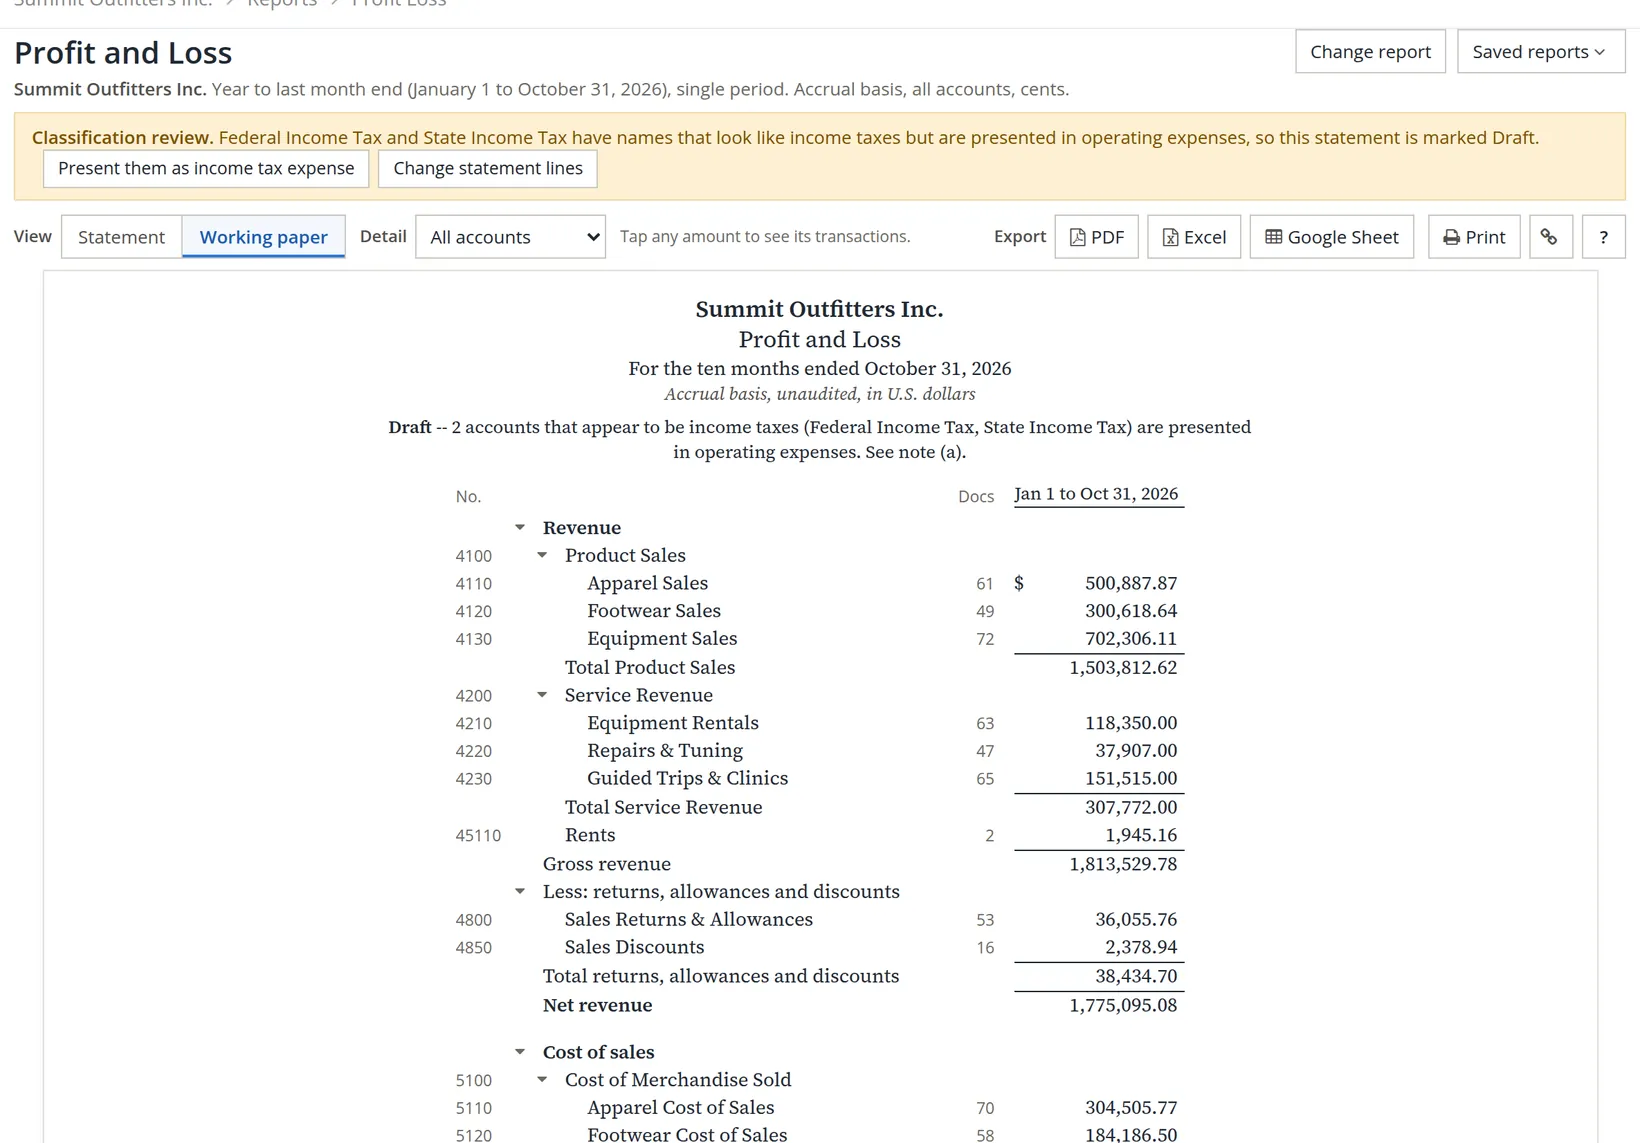
Working paper. Click Working paper beside Statement for the accountant's view: each account's number, and how many documents make up each figure.
Profit and Loss or Income Statement?
Both show income and expenses for a period. The Profit and Loss is the full presentation, with comparisons, trends and percentages. The Income Statement (Reports → Income Statement) is a simpler listing, also offered as Month and year to date side by side, which many owners prefer for a monthly review.
Check your understanding
1. Gross profit $722,878.35, net revenue $1,775,095.08. What is the gross margin?
Answer
About 40.7% (722,878.35 ÷ 1,775,095.08).
2. Moving the income tax accounts changed operating income. Did it change net income?
Answer
No. Presentation changes where accounts appear, not their balances.
3. Which view shows account numbers beside each line?
Answer
Working paper.